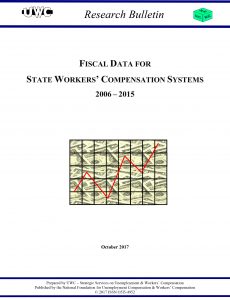
 The annual Workers’ Compensation Fiscal Data Research Bulletin showing state workers’ compensation system payments and costs from 2006 to 2015 is now available for purchase.
The fiscal bulletin shows the continued economic expansion and trend toward lower benefit cost rates. The number of covered workers in all states increased from 129.9 million in 2014 to 132.4 million for 2015.
States had significantly different costs per employee, with the following highest and lowest benefit costs per employee in 2015. Note: the benefit cost per covered employee is not a specific measure of costs to employers for comparable work across states and does not account for differences in industrial composition of a state work force.
Highest
- Washington ($789)
- California ($752)
- Alaska ($720)
- New York ($654)
- Wyoming ($648)
- New Jersey ($595)
Lowest
- Texas ($168)
- Arkansas ($193)
- Indiana ($196)
- Utah ($215)
- DC ($220)
- Tennessee ($259)
The only states with increases from 2014 to 2015 in average benefit cost rate (cost per $100 in payroll) were:
- Hawaii (4.8%)
- South Dakota (3.1%)
States with the greatest decreases from 2014 to 2015 in average benefit cost rate (cost per $100 in payroll) were:
- Illinois (-16.7%)
- Delaware (-12.4%)
- Maine (-11.7%)
- Florida (-11.0%)
- Oregon (-10.7%)
The detail for all states going back 10 years is provided in the bulletin.


